
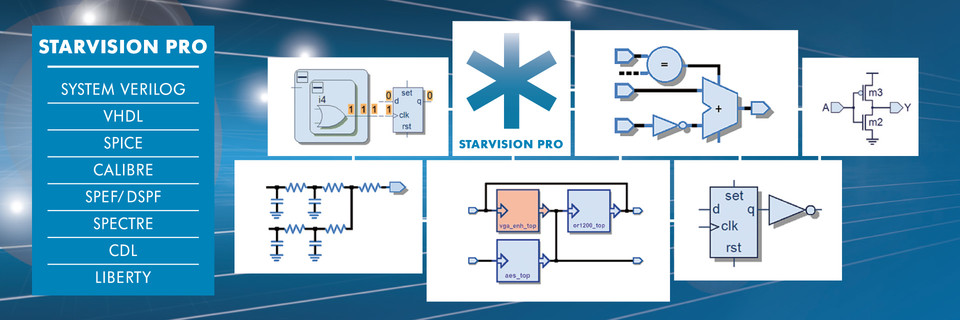
StarVision PRO
SoC, Multi-mode Debug for Transistor, RTL, and System-Level Designs
Modern semiconductor debug represents more than a quarter of the entire development process, and requires the most intensive engineering effort. As System-on-Chip (SoC) devices become larger and more diverse, containing analog components, third party IP and multi-core processors, debug tools must adapt to these new requirements.
StarVision® PRO represents the state-of-the-art in debug solutions for advanced electronic SoCs. The incorporation of Concept's leading visualization and detection technology enables rapid cause-effect analysis for efficient functional analysis. This advanced and unique mixed-mode debug platform seamlessly combines SPICE and transistor analysis from our market leading SpiceVision PRO tool with digital RTL and gates from our advanced RTLvision PRO tool. It is fully customizable and incorporates many advanced features not available in other debug solutions, to handle the most complex of SoC platforms.
- Powerful general-purpose debugger for rapid cause-effect resolution
- Effective mixed-mode, RTL, Gate, SPICE and post-layout level debug
- Customizable tool platform with specialized SoC & IP capabilities
Advanced, General-Purpose Debug
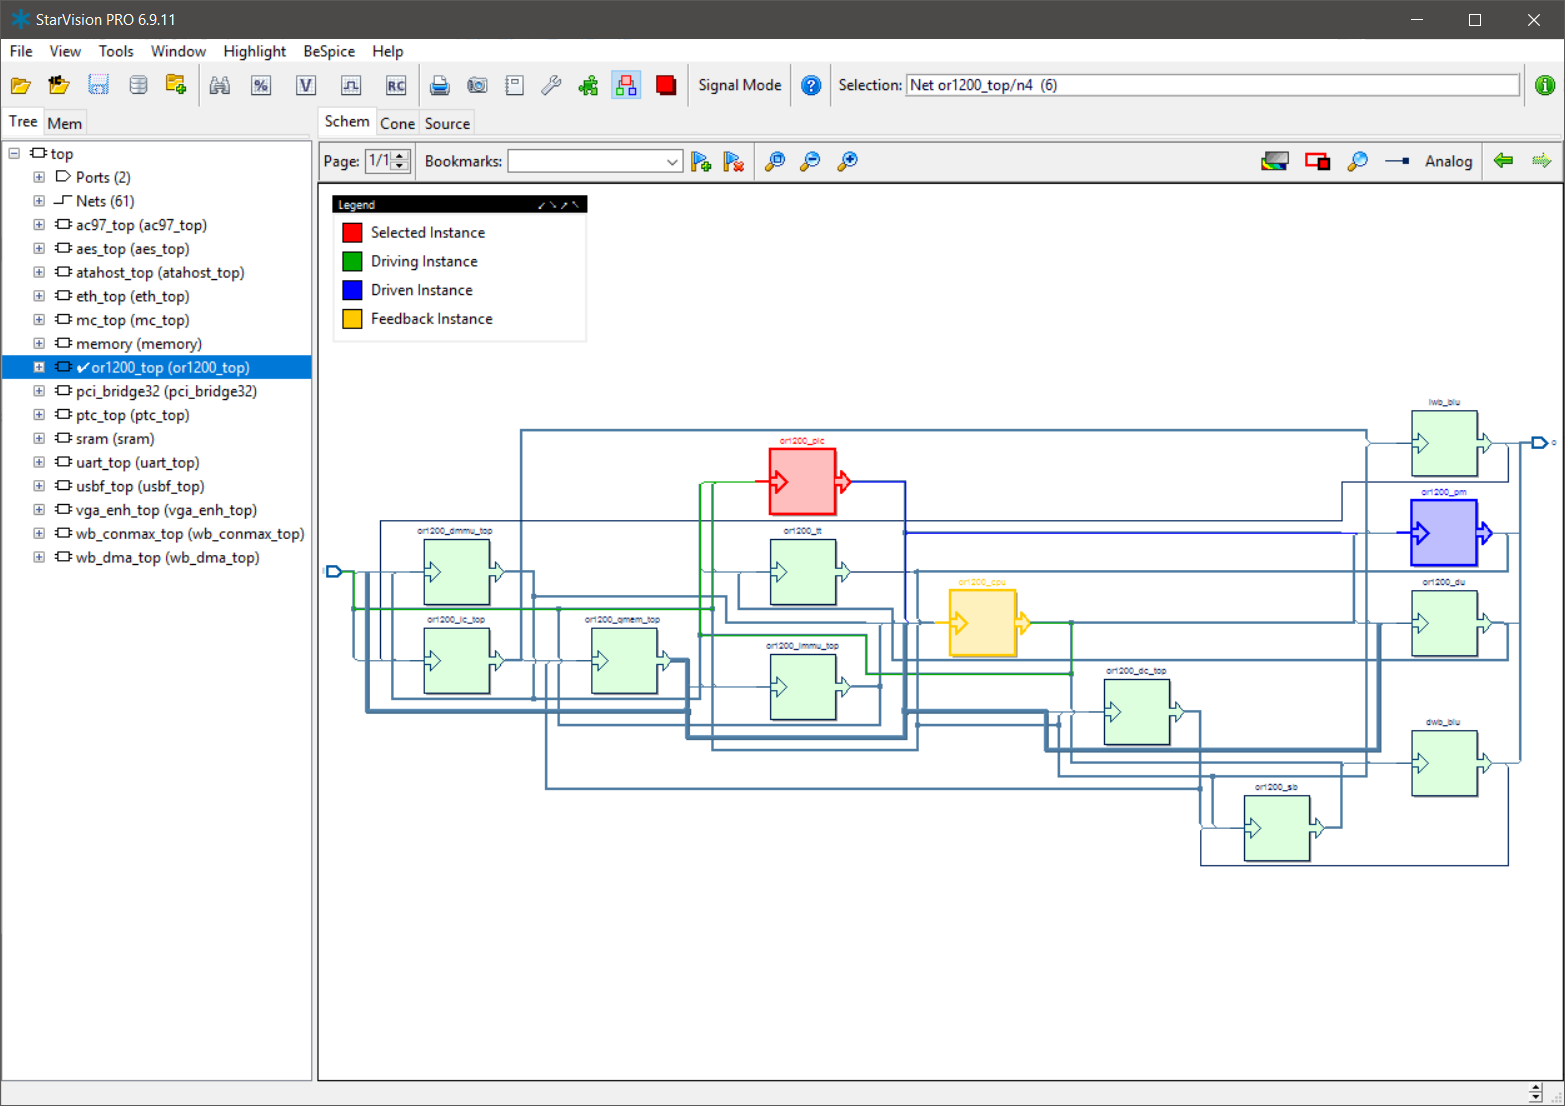
IP-Based SoC Debug – Working with third party IP requires the comprehension of unfamiliar code. Concept's visualization technology allows unfamiliar sections of the SoC to be easily understood, enabling fast IP integration and problem resolution. Due to the many different data formats supported by StarVision PRO engineers can explore, analyze and debug almost any SoC and IP building block within a single, easy-to-use debug cockpit.
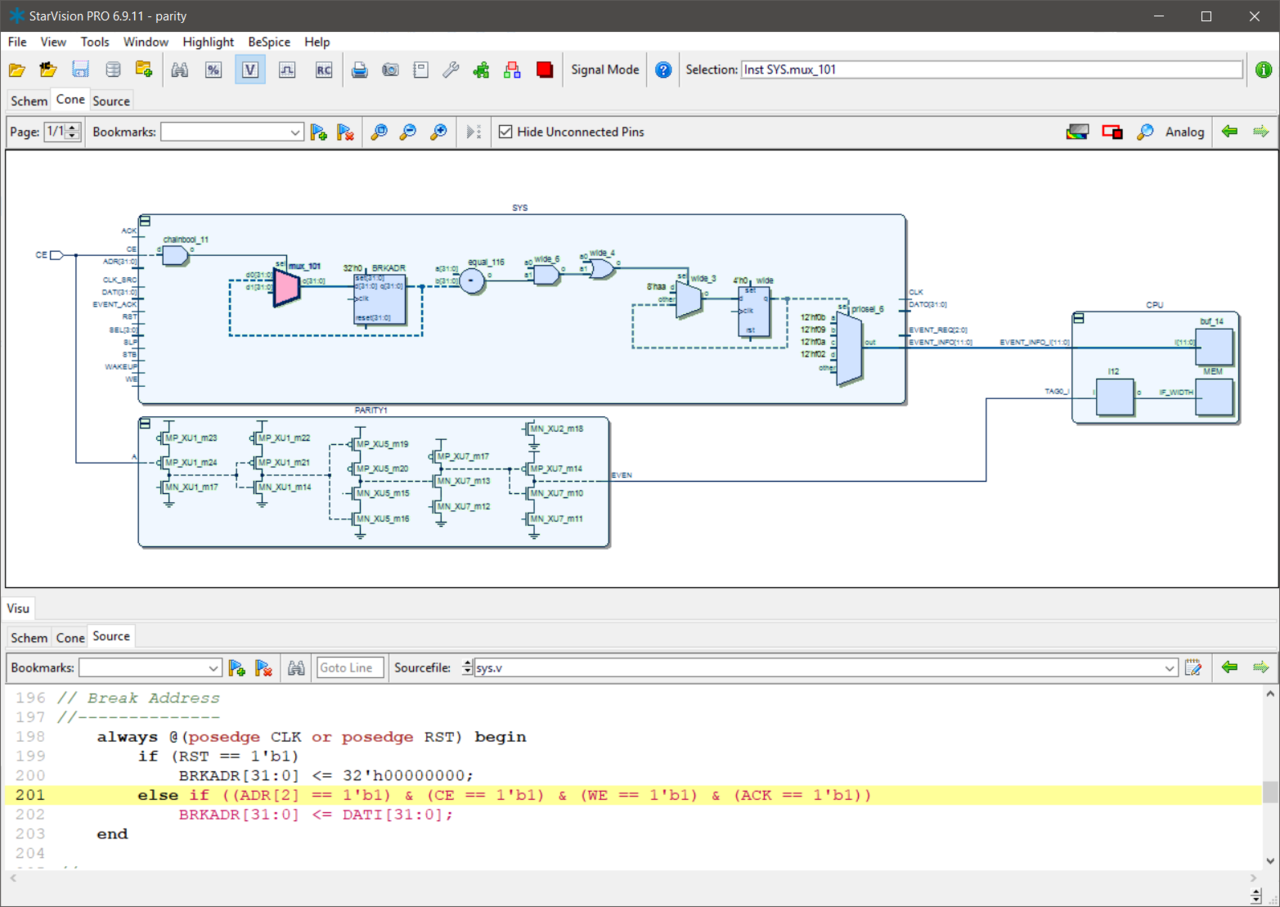
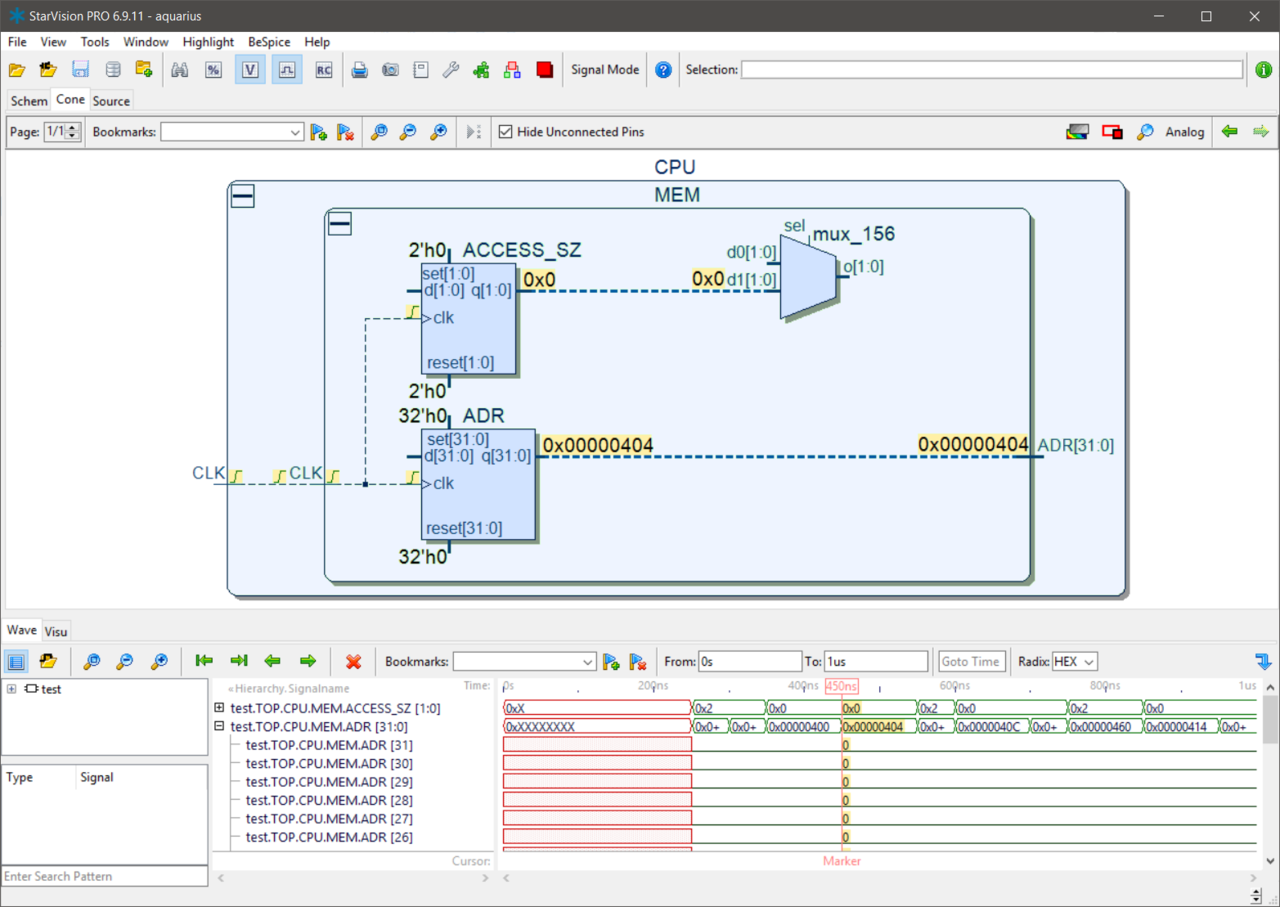
Path Extraction & Logic Cone Window – The customizable path extraction engine can automatically identify and extract critical paths in a design, allowing for bugs to be easily tracked from observation point to actual cause. A configurable logic cone window can also be displayed to rapidly examine drive logic. These two features provide fast cause-effect observation, the heart of accelerated debug.
Easy Design Exploration – Leveraging Concept's leading visualization technology, the interactive design navigation window shows schematic fragments of just the critical portion of the design linked to the original source code (RTL, Netlist, SPICE) and to simulation results.
Abstract SoC View – Today's SoCs, containing a myriad of IP blocks and complex interconnect, have reached complexities that make it very hard for engineers to understand component structure and interaction. StarVision PRO automatically generates displays of complex design sections showing overall functional blocks with important information and structure. This provides a quick overview of the SoC under investigation, which may be instantly flipped to reveal abstract or detailed information.
Analog, Mixed-Mode and Transistor-Level Debug
Integration of RTL, Gate, SPICE Debug and Visualization – In SoC design, engineers need to work at different abstraction levels, for example, RTL, gate, transistor, analog, and parasitic. StarVision PRO provides full analog debug and analysis, mixed with digital debug that leverages waveform, schematic and other displays. StarVision PRO enables engineers to find connection points where analog and digital circuits meet and can check to ensure a clean "transition."
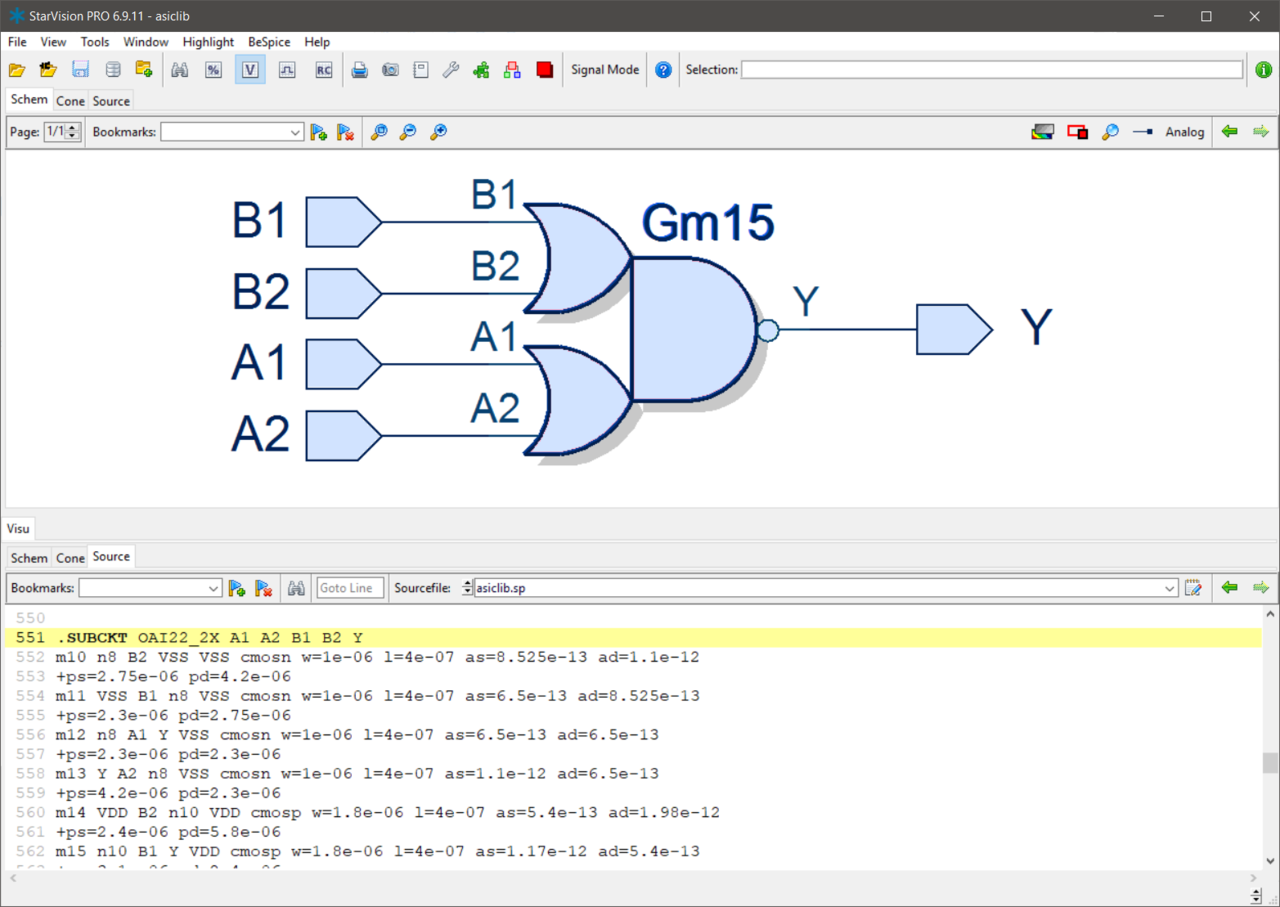
Automatic Logic Recognition – The built-in automatic logic recognition engine creates digital logic symbols from pure SPICE-level netlists for easy transistor-level design exploration and analysis.
Parasitic Analysis for Post-Layout Debug – Parasitic networks can be analyzed and displayed visually. SPICE netlist fragments may be automatically created or pruned for the further debug of critical circuit sections.
Specialized Functionality and Customization Features
Clock Tree Extraction – Clock signals are often a source of problems in complex SoC design. StarVision PRO automatically extracts and analyzes clock trees and gives an immediate, configurable view of clock networks and domains. Clock Domain Crossing (CDC) logic may be automatically extracted and analyzed.
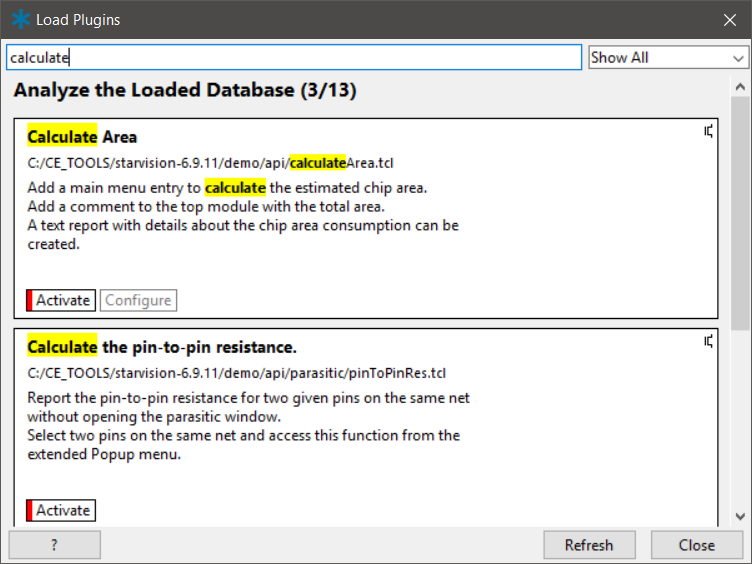
User Specific Customization – API access is provided to all aspects of StarVision PRO, allowing for extensive customization and specialized features to be easily coded in TCL and executed. Many UserWare examples are provided with StarVision PRO.
UserWare Plugin Mechanism – In order to make it easy for organizations to manage and deploy customized tool features within an organization, StarVision PRO comes with a smart UserWare plugin mechanism that makes it very easy to add and exchange new tool features within development teams and organizations.
C Code Customization – In addition to the Tcl UserWare interface, a C API is also provided that allows application specific C code to be bundled into to the debugger. This allows end users to add new tool features with full access to the tool database and internal data structures and offers broad data iteration and modification. Examples of applications that have been coded into the tool include linting, netlist pruning, and FPGA partitioning.
Waveform Viewer and Signal Tracing – StarVision PRO comes with a fully integrated digital waveform browser and with support for interactive signal tracing in the source code, schematic view and waveform window. StarVision PRO compiles simulation output into a high-performance database for accelerated waveform browsing and signal tracing.
Supported Platforms
Linux and Windows on x86_64 systems.
See Platform Support DetailsStarVision PRO Product Options
Virtuoso/SKILL Export:
Allows export of schematics and schematic fragments
to the Cadence design tool platform for further optimization, reuse or debug
within the Cadence tool flow.
Demo video for the "SKILL Export" feature
Analog Waveform Viewer:
Allows visualization of SPICE simulation data and
cross-probing between schematic view and waveform view for easy waveform
browsing and signal tracing.
Demo video for the "Analog Waveform Viewer" feature
At a Glance
| Features | Benefits |
|---|---|
| Ultra fast HDL reader and graphics on the fly | Graphical representations make it easier to understand, debug, change and optimize SystemVerilog, VHDL and Verilog code |
| Schematics from SPICE netlists | Schematics provide easier and faster debugging for complex circuits. Supported dialects include SPICE, HSPICE, Spectre, Calibre, CDL, Eldo and PSPICE. |
| 64-bit database | Higher performance and increased capacity, for very large designs |
| Powerful GUI | Multiple views, including tree, schematic, waveform and source file plus drag and drop between different views for increased circuit understanding |
| Cone Window | Incremental schematic navigation for easy design exploration and reduction of complexity |
| Tcl UserWare API | Allows interfacing with tool flow and definition of electrical rule checks |
| Circuit fragment save | Circuit netlists can be saved as SPICE, Verilog or SPEF files for future reuse as IP, or for partial simulation |
| Automatic clock tree and clock domain extraction and visualization | Fast detection and resolution of clock domain problems |
| Full support for mixed language and mixed-signal designs | Designers can easily develop and debug today's most complex heterogeneous SoCs and IPs (SystemVerilog, Verilog, VHDL, SPICE, HSPICE, ...) |
| Parasitic analysis features | Allows visualization, analysis and pruning of parasitic networks (DSPF, RSPF, SPEF) and provides capabilities to export SPICE netlists for critical circuit fragment simulation. |